How To
Use Activity Monitor to Monitor Your Mac’s Memory
In last month’s column, I talked about Activity Monitor as my candidate for one of the most under-utilized applications included with Mac OS X. I focused primarily on the basics of the Activity Monitor window and proposed using it to quit currently running processes. It’s particularly useful for those processes that have hung but do not appear in the Force Quit dialog. Activity Monitor will also quit processes initiated by other users if you enter an administrator password.
These are all perfectly good uses for Activity Monitor, but my first contact with it was to examine some memory-related issues on my G5. After I began researching the previous article, I discovered that, with a little thought, Activity Monitor can tell you more than just how much memory is being used on your computer. Is your Mac using the memory that it has efficiently? Do you need to add more memory? Activity Monitor may provide some clues to these questions.
Background Information
Last month I mentioned that the upper two-thirds of the Activity Monitor window provides information about individual processes.
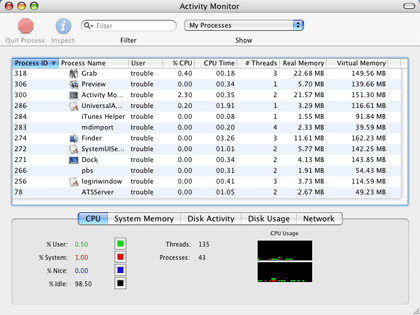
The Main Activity Monitor Window
The lower third of the window is geared toward examining some system-wide information. There are tabs for CPU Use, System Memory, Disk Activity, Disk Usage, and Network. Let’s look at each of these areas briefly:
- The CPU tab provides graphical and textual representations of how your Mac is using its processor(s). Do not be surprised if the largest percentage is designated idle. Even with a word processor, Web browser, QuickTime Player, Preview, Activity Monitor, and Mail open, my system CPU stats hovered around 85 percent idle. This number will of course change depending upon how complex the tasks are that you are performing. There’s not much you can do to change the numbers in this tab, but they are interesting to peek at from time to time.
- The System Memory tab displays its data as a Pie Chart. The whole “pie” represents the total amount of physical memory installed in the system. In my case it is 512 MB. That “pie” is then divided into Wired, Active, Inactive, and Free. Before you interpret this graph, make sure that you understand each of these categories. Before I read this Apple article I could not understand why I often had 150 to 200 MB of memory listed as inactive. After all, the memory was there, why wasn’t it being used? It turns out that the information stored in “inactive” memory is in RAM but has already been cached to disk. If the information is needed it is taken from RAM. If another application needs that memory it’s available for use.
- The Disk Activity tab graphically represents the amount of data that has been written to disk. It’s mostly useful for the seriously geeky among us. I do check this tab from time to time just to see if there has been a significant change.
- The Disk Usage tab shows how much disk space is used and how much remains free. If you have more than one disk attached, you can change the target drive using the pop-up menu on the left. I almost never use this tab unless I already have Activity Monitor open. Most of the time I either open a Finder window for the drive I want to examine or use the Get Info command.
- The Network tab provides graphical representations of the amount of network traffic going in and out of my system. About the only time I pay attention to this tab at all is if I seem to be having network trouble. If your network is behaving well now, look at this tab to get a rough idea of how your system is performing. Use this as a baseline to gauge future activity levels should a problem arise.
The statistics provided by Activity Monitor fluctuate as you use your system. Activity Monitor won’t sound an alarm if you need more memory, but it may give you a clue if you know how to listen. We’ll get to that issue in a minute, but let’s first decide whether your Mac is making the best use of the memory it already has installed. In other words, “Did your Mac spring a memory leak?”
Finding Potential Memory Leaks
If you are a long-time computer user you have probably encountered reports that a given application might have a memory leak. Memory leaks occur when a computer program fails to release memory that it is no longer using. In extreme cases the program continues to consume memory to the extent that the entire system’s performance is affected. For operating systems such as OS X that make use of virtual memory, it can take quite some time for the program’s performance to degrade significantly. If you are having a memory leak this process, based on this Macworld article, may help identify the culprit.
- Open Activity Monitor’s main window and set the pop-up menu to “My Processes.” If the Real Memory column is not visible, go to the View menu, choose Columns, and select the Real Memory option.
- Click on the header for the Real Memory column until the arrow points downward. The amount of memory used by each process will be listed in descending order. These values are updated regularly, so watch to see if any of the numbers is climbing. If you find one that is climbing but you haven’t changed the tasks being performed by the program, it might be the culprit. This behavior can also cause the numbers to rise in the virtual memory column, so be sure to check there as well.
- If you quit the offending program and your Mac returns to normal, this might be the cause of your problems. Having this issue occur occasionally may not indicate a problem, but this should not happen consistently.
Safari is one application that many users have suggested has memory consumption issues when used heavily for extended periods of time. Quitting Safari and re-launching the program will clear the memory cache (and any potential leaks) and resolve the issue.
If you are consistently seeing poor performance after launching a particular application and you have adequate memory it might be time to contact the developer. Whether it’s a fast memory leak that degrades performance quickly or a slow leak that takes time to affect performance, this is not something that users can solve; it’s going to take some reprogramming to fix.
Have I Got Enough Memory
Before you decide that a memory leak is present, let’s try to decide whether you have enough memory installed. That’s not as simple an issue as you might think. If, like I do, you only have 512 MB of memory, you will likely notice improved system performance after installing additional memory. If you already have 2 GB of memory installed and only run one or two programs, an additional GB of memory might not make a noticeable performance difference. How do you know whether or not to add additional memory?
Start by clearing out any problems that might have accumulated by restarting your Mac and logging in as usual. Launch Activity Monitor and click on the System Memory tab. Pay particular attention to the amounts of free and inactive memory shown in the pie chart. Make a mental note of these numbers or jot them down.
Now that you have a good idea of how your Mac uses memory when it first starts, it’s time to do a little work. Launch applications and work with your Mac as you normally do. Periodically check Activity Monitor and look at the amount of free and inactive memory that is available. According to Apple, if the numbers for both free and inactive memory are getting low, it might be time to add additional memory. Keep in mind that most current systems require (or can achieve a performance boost from) adding RAM modules in pairs.
If you want further confirmation of whether additional memory is needed, Terminal can provide you with the number of page-ins and page-outs that have occurred. Most importantly it shows the number of page-ins/outs per second. These numbers represent how often data is passed between the drive and memory. The more often this occurs, the more likely it is that adding extra memory will prove beneficial, so that your Mac won’t need to spend as much time reading or writing to disk the data that doesn’t fit in RAM. This post describes which Terminal commands to run and how to interpret the results. Even Unix-challenged folks such as myself can follow these directions.
• • •
That’s it for this month. It’s time for me to get back in the lab and see what I can cook up for next month.
![]() Copyright © 2006 Sylvester Roque, sroque@atpm.com.
Copyright © 2006 Sylvester Roque, sroque@atpm.com.
Also in This Series
- Give Alert Sounds a Little Personality · March 2012
- Create Your Own iPhone Ringtones · February 2012
- Create Your Own Homemade Audio Book · December 2011
- Upgrade to Lion Painlessly · August 2011
- Make the Most of TextEdit · July 2011
- Using the Free Disk Utility on Your Mac · May 2011
- Making Use of QuickTime X · March 2011
- Making the Most of What’s Already on Your Mac · February 2011
- Making the Most of What’s Already on Your Mac · January 2011
- Complete Archive
Reader Comments (7)
You can also convert Inactive Memory to Free Memory.
http://www.activata.co.uk/products/ifreemem.html
You have explained this is a simple to understand format, yet covers detail beyond the obvious.
Will be looking into your other articles.
The "data sent" and "data received" indicators on the NETWORK tab:
over what time period is this?
Is it the data I've used/sent over the last month? (30days?)
Can I use this to gauge my broadband needs?
Thanks
Your explanation of Inactive Memory being "already cached to disk" seems to suggest that this memory has been stored in the pagefile. It's actually the other way around — inactive memory is disk data (i.e. files/applications) that's been cached in RAM so that if you re-open them or if an application needs to re-read data from a file, it will be much faster.
In general, files will remain in this "disk cache" / "inactive memory" to the point of filling all Free memory, and when your applications need more memory, the files in the disk cache are cleared to make space.
This can cause some people to believe that they don't have enough RAM (since after, say, looking through their photos in iPhoto, they have almost no free memory), even though Mac OS X is just using the Free memory to speed up their disk access.
Programs like iFreeMem (as suggested by John Wylie) are not always useful — most of the time Mac OS X does intelligent things with its disk cache (inactive memory) and after you 'free' your memory using iFreeMem you'll notice that everything runs quite slowly for 10-60 seconds while a lot of files are re-read from the disk and put back into the cache.
'Freeing' your memory like this is only useful if
a) OS X is mistakenly caching too much (I think a bug existed in 10.5 where it would allow the disk cache to grow too large and have to swap data to the pagefile! — seems to have been fixed in 10.6), or
b) if you're doing something like processing a very large number of files (e.g. batch processing images in Aperture/iPhoto) and the disk cache is keeping every file in memory (despite the fact that they're accessed only once each) — the only real problem with this is that there's a time delay in clearing space from memory, and it seems to be faster to do it all at once (with iFreeMem or similar) than having OS X clear a small amount of space for each file as it's read in
Add A Comment